# Overview
The FizzGate integration platform will push the access request data (IP address, gateway group, service, application, request method, API Path, request time) to Kafka, and manage the background consumption Kafka message statistics interface access data.
The interface statistics function displays the total number of interfaces and access times per day in a specified time period in the form of a chart. You can view the total number of historical accesses to the interface and the most recent request time.
# Interface access statistics
Menu location: Gateway Management > Interface Statistics. Click the menu to enter the interface statistics page, as shown in the figure.
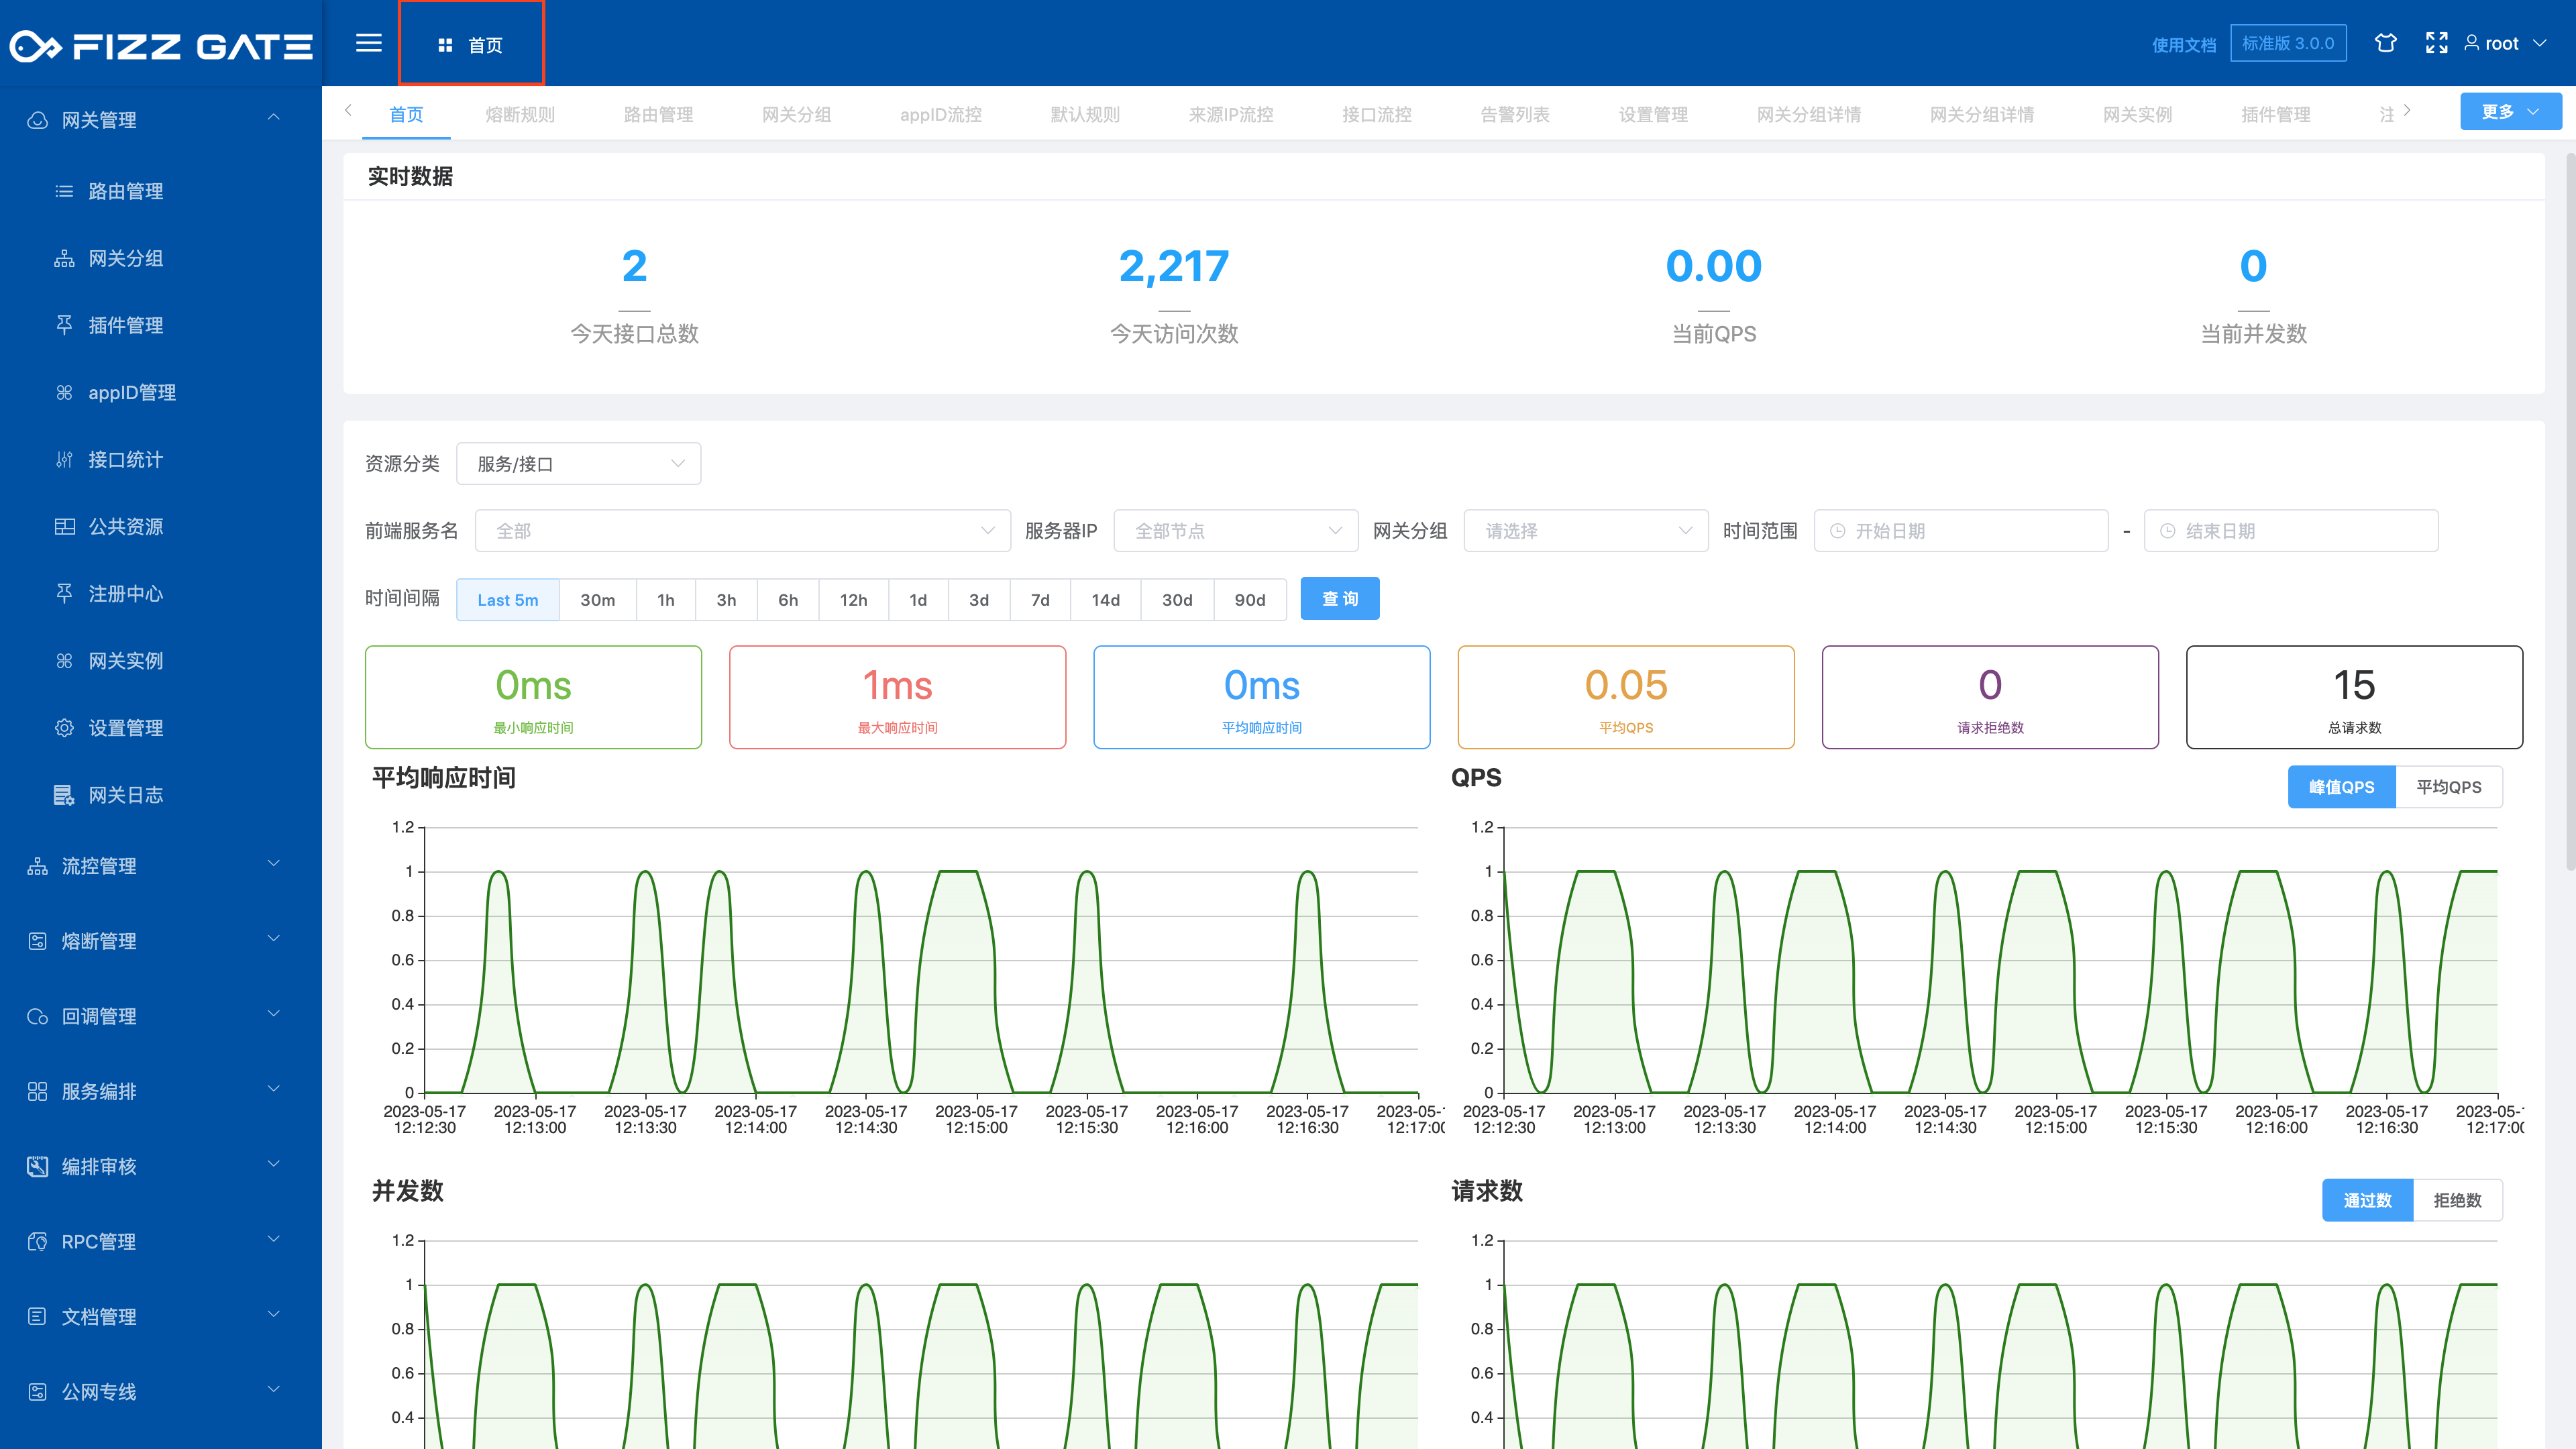
Total number of interfaces today: the total number of different interfaces called from 0 to the current moment;
Number of visits today: the total number of access requests from 0:00 to the current moment.
Total number of interfaces chart: Displays the curve of the total number of different interfaces called every day within the specified time period;
Visit count chart: Displays the curve of the total number of daily access requests within a specified time period.
# Request statistics
The lower part of the interface statistics interface is the request statistics list, as shown in the figure.
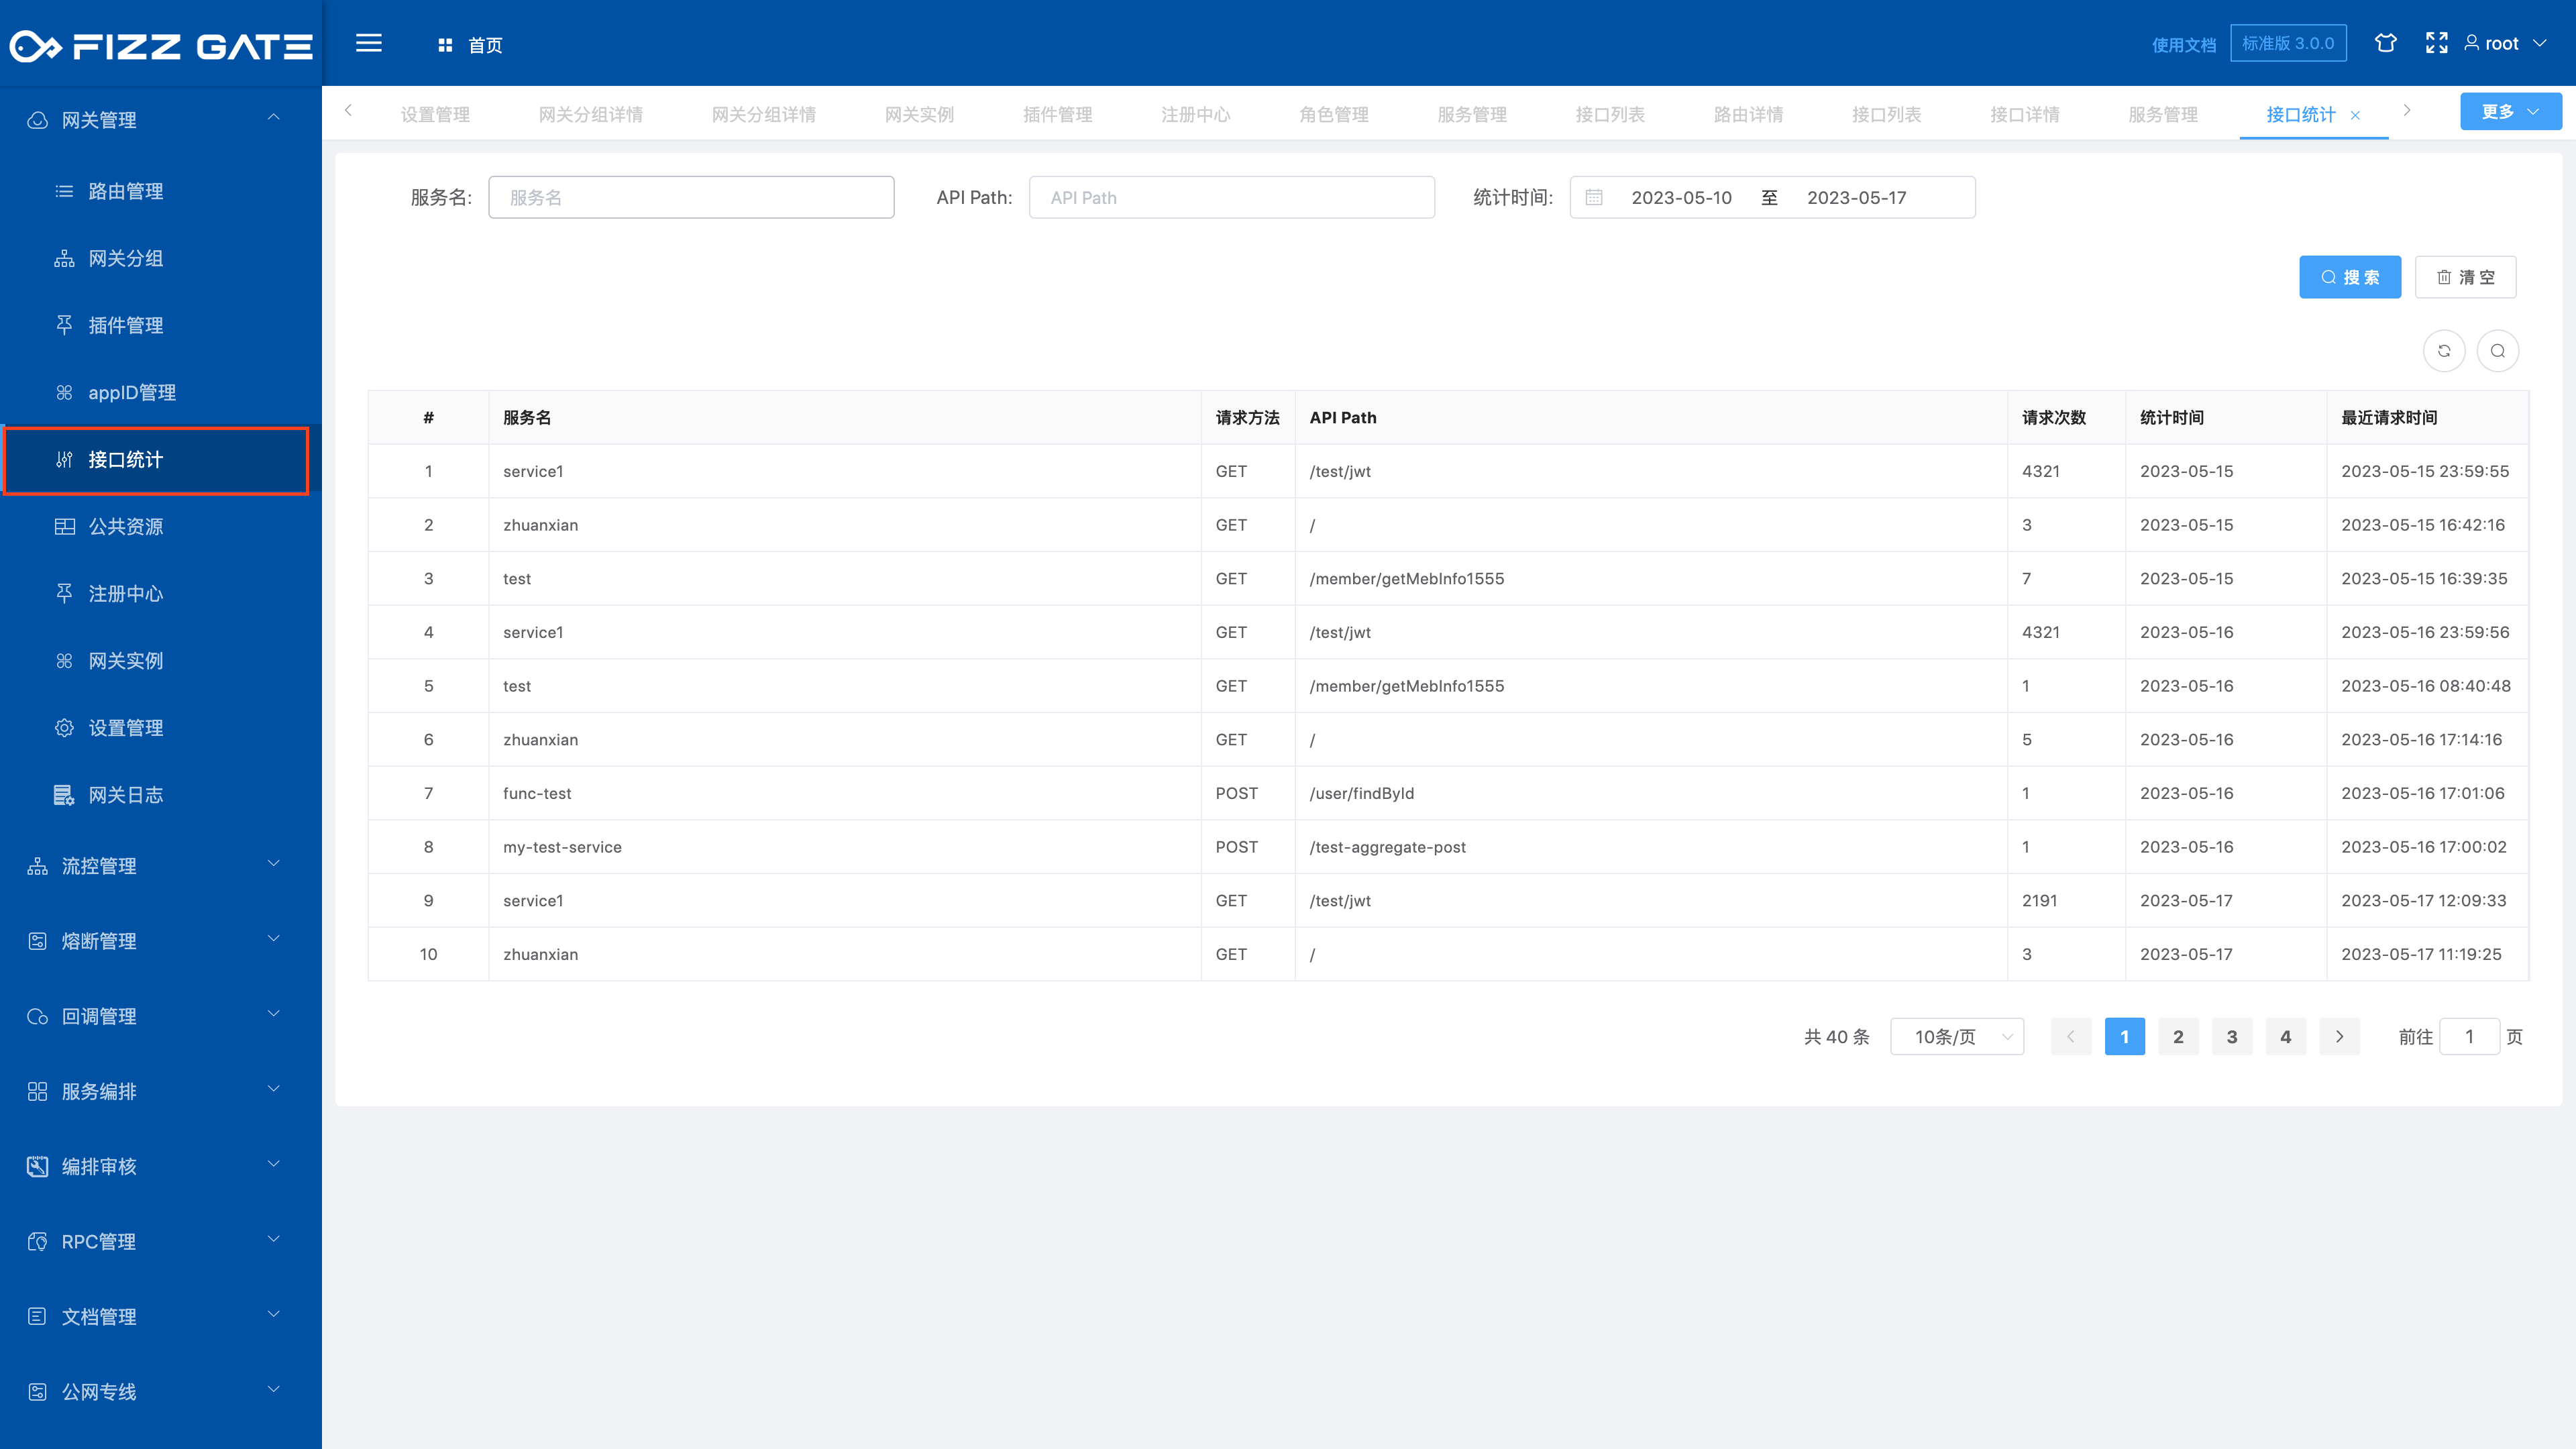
Source IP: the actual entrance IP address requested by the gateway;
Number of requests: (unique [source IP, gateway group, service name, request method, appID, API Path]) total number of historical requests;
Last request time: (unique [source IP, gateway group, service name, request method, appID, API Path]) last call time.